
Proximity Analysis
Proximity Analysis is an analytical technique used to determine the relationship between a selected point and its neighbors. The distance between point A and point B may be measured as a straight line or by following a networked path, such as a street network.
This kind of analysis is particularly useful for marketing professionals as it helps them to analyze demographics and infrastructure to determine trade areas.
Proximity Analysis allows users to get answers to spatial questions like:
- How many houses are there within 5 kilometers from a hospital?
- Are there any highways fall within 500m of a forest?
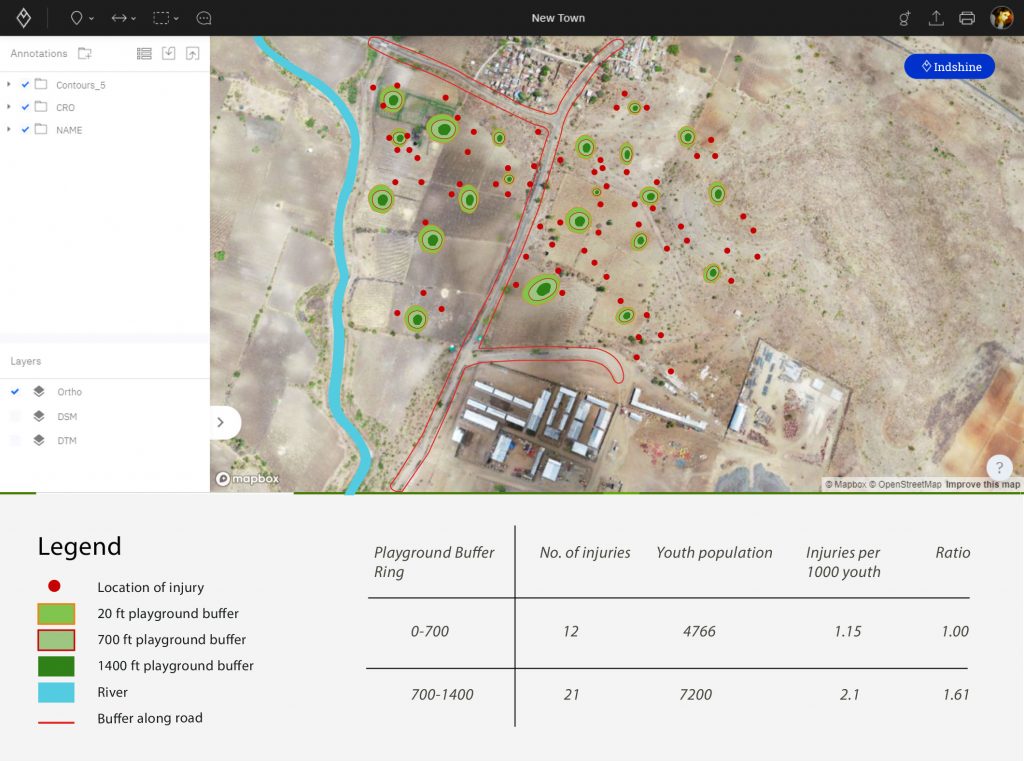
Here’s an example of proximity analysis where a study is done to recognize the areas which are more prone to injuries. Three buffers are drawn with respect to playgrounds at 20ft, 700ft, and 1400ft. It was found that most injuries (95%) occur in the areas outside the 700 ft buffer. Therefore, the results from proximity analysis clearly indicate the need for playgrounds in cities.
Image showing proximity analysis in advanced GIS analysis
Proximity tools can be divided into two categories depending on the type of input the tool accepts: features or rasters. The feature-based tools vary in the types of output they produce. For example, the Buffer tool outputs polygon features, which can then be used as input to overlay or spatial selection tools such as Select Layer By Location.
The Near tool adds a distance measurement attribute to the input features. The raster-based Euclidean distance tools measure distances from the center of source cells to the center of destination cells. The raster-based cost-distance tools accumulate the cost of each cell traversed between sources and destinations.
Network Analysis
Network analysis is an operation in GIS which analyses the datasets of geographic network or real world network. This kind of advanced GIS analysis involves examining the properties of natural and man-made network to gain an understanding of the behavior of flows within and around such networks and locational analysis.
Network analysis as part of advanced GIS analysis primarily includes analyzing a set of connected lines, representing railways, streams, roads, waterlines, pipelines, telecommunication lines etc. Network analysis helps in analyzing movement of people, connectivity and accessibility of railway, roads, pipelines and telecommunications, flow of matter and energy and movement of goods and services. Network analysis in GIS helps in planning, development and accessibility.
In the example below, the most feasible network path to the nearest facility of the fire station is identified. This network deduced is dependent on many factors that include the shortest distance path, a limited number of resources, traffic on road and any blockage or construction on the road. Thus, after considering all these factors station 2 is recognized as the closest facility though station 5 is at the shortest distance but we had a blockage in its path.
Image showing network analysis in advanced GIS analysis
Hillshading Analysis
Hillshading in GIS is used for creating relief maps, which indicate the topographical shape of hills and mountains using shading (levels of gray) on a map. This technique is used to indicate relative slopes, mountain ridges, and not absolute height.
In Hillshading analysis, the terrain is illuminated with a hypothetical light source and visualized as a shaded relief. The illumination value for each raster cell is determined by its orientation to the light source, which is based on slope and aspect.
Here is a project explaining hillshading analysis.
Hillshading analysis in GIS can be classified mainly in three categories:
- Slope shading: In this case, tonal strengths are proportional to the angle of slope (the steeper the darker).
- Oblique light shading: The pattern of light and dark on relief surface is produced by an oblique light source.
- Combined shading: A combination of slope and oblique shading.
Viewshed Analysis
The process of identifying locations that are visible from one or more observer points is known as Viewshed analysis in GIS. This kind of advanced analysis in GIS is also called line-of-sight analysis or intervisibility analysis. When a telecommunications company wants to build communication towers with direct lines of sight from one tower to the next or an ecologist wants to set up infrared cameras to monitor their field site for animal activity with the best possible coverage, then Viewshed analysis is carried out.
The Viewshed analysis becomes perfect when it offers an unobstructed view from an observer point (also called a view source) to an object of interest (target) in any direction, where the target is coincident with the ground. However, variables like the height of the observer point, the angle of the horizontal range of the observer point (Horizontal field of view), the angle of the vertical range of the observer point (Vertical field of view), the vertical pointing angle of the observer point’s line of sight (Pitch) and the azimuth which is the angular direction of the sun, measured from the north in clockwise degrees from 0 to 360, often constrain the observer points. For properly modeling a restricted line-of-sight analysis, one must take into account these view constraints.
Here’s an interesting example of how CCTV planning can be done for various smart city projects through view-shed analysis. GIS can help us the decide the number of CCTV cameras required to cover the important parts of cities, can suggest us the blind spots and can also give us the height of poles at which CCTV camera needed to be placed. This all in-turn will give the budgetary requirements and plan of action for the whole project of CCTV surveillance.
Image showing viewshed analysis in advanced GIS analysis
Don’t Miss: The importance of maps in the times of crisis
Density Analysis
Density surfaces show where point or line features are concentrated. This advanced analysis of GIS takes known quantities of some phenomenon and spreads them across the landscape based on the quantity that is measured at each location and the spatial relationship of the locations of the measured quantities.
For example, you might have a point value for each town representing the total number of people in the town, but you want to learn more about the spread of population over the region. Since all the people in each town do not live at the population point, by calculating density, you can create a surface showing the predicted distribution of the population throughout the landscape.
The following example on how population density is varying with location. The density analysis can give insights on demand-supply, resources and infrastructure required, health and benefits needed, and various essential plans to be carried out for community benefits. The population density plays a key role in every aspect of governance.
Image showing density analysis in advanced GIS analysis
Another application of density analysis
Consider a retail store chain that has multiple stores in a particular district. For each store, the management has sales figures on customers. The management assumes that customers prefer one store over another depending on the distance they have to travel to reach the store. Consequently, it can be naturally assumed that a particular customer will always choose the closest store. However, shoppers farther away may also shop at other stores.
If the management wants to study the distribution of where the customers live, then density analysis provides the answer. Using the density tool, the management can create a surface of customers, from the sales figures and the spatial distribution of the stores.
The density tool considers where each store is in relation to other stores, the number of customers shopping at each store, and how many cells need to share a portion of the measured quantity (the shoppers). The cells nearer the measured points, the stores, receive higher proportions of the measured quantity than those farther away. This way the management is able to know the distribution of where the customers live by intelligently spreading the customers out across the landscape.
Hydrological Analysis
Hydrological analysis is widely used in regional planning, agriculture, forestry, disaster prediction, road design, and many other industries and fields.
In Hydrological advanced analysis in GIS, digital elevation model (DEM) raster data is used to establish a water system model, which is used to study the hydrological characteristics and simulation of surface hydrological processes. On the basis of this analysis, a forecast of the future surface hydrological situation is made. The hydrological analysis model can help us to analyze the scope of the flood, position the runoff pollution sources, and predict geomorphological change on runoff.
The hydrological analysis helps in solving water-related problems such as environmental preservation, natural disasters, and water management. Here’s an interesting example where the flood risk assessment is done depending on various maps of various other factors like slope (S), height above the nearest drainage, distance to streams, total precipitation, and effective precipitation, etc. The assessment will help in taking adequate measures before a flood occurs and planning the rescue operations in case of floods thereby saving from the loss of both property and life.
Image showing hydrological analysis in advanced GIS analysis
Surface Analysis
Surface analysis in GIS involves different kinds of processing, including extracting new surfaces from existing surfaces, reclassifying surfaces, and combining surfaces. Certain tools extract or derive information from a surface, a combination of surfaces, or surfaces and vector data. Surfaces can be represented using contour lines or isolines, arrays of points, TINs, and rasters; however, most surface analysis in GIS is done on raster or TIN data.
Surfaces represent phenomena that have values at every point across their extent. The values at the infinite number of points across the surface are derived from a limited set of sample values. These may be based on direct measurements, such as height values for an elevation surface, or temperature values for a temperature surface; between these measured locations, values are assigned to the surface by interpolation.
Surfaces can also be mathematically derived from other data, such as slope and aspect surfaces derived from an elevation surface, a surface of distance from bus stops in a city, or surfaces showing the concentration of criminal activity or probability of lightning strikes. These kinds of advanced GIS capabilities help with modeling terrains, finding suitable locations and routes, discovering spatial patterns, and performing hydrologic and statistical analysis.
Here is an interesting example where volumetric analysis of the surface gave earthwork needed for leveling the land, thereby preparing for construction. Contour lines hereby represent the elevation strata across the different points of the surface.
Image showing surface analysis in advanced GIS analysis
Summarizing, advanced GIS analysis can help in
- Analyze terrains: Derive useful insights from your data. Create a hill-shade to use as a backdrop of the terrain to support other data layers. Calculate slope, aspect, and contours, or create a map displaying visibility
- Select the best locations: Find the ideal location with features that match your requirements. Consider criteria such as suitable demographics, environment, and terrain to find the best site
- Find best routes: Find the straight-line distance between two locations or create cost-weighted distance surfaces to understand the cost of getting from one location to another based on the criteria you specify
- Perform hydrologic analysis: Derive insights from hydrologic and landscape data. The model where water will flow, create watersheds and stream networks and discover other hydrologic characteristics
- Gain statistical insights: Analyze data distribution for a period. Calculate the mean crop yield over ten years, study a variety of species contained within each neighborhood, or find the mean elevation per forest zone
- Manage risk: Model risk factors such as ground slope, aspect, stability, forest fuel load and coastline inundation to understand the risk over your study area so you can come up with the appropriate mitigation plan
- Estimate cost: Depending on your industry, factors such as terrain, waiting time, or any other physical obstacles can add to your cost. Analyze and predict costs taking into account multiple factors
- Detect patterns: Analyze data from the past to uncover patterns. Combine location of crime with societal factors to visualize patterns that help law enforcement and city planners to take appropriate measures
